Blog
AI Agent Interoperability: How Connected Agents Align Sales and Marketing
October 22, 2026
Read more

TL;DR: Sales metrics measure a specific part of your process, while KPIs tie that same data to a target and a business outcome. What matters most splits into five categories: activity, pipeline, lead generation, productivity, and revenue, with revenue metrics like ARR and net revenue retention showing whether the business is actually growing. Tracking everything without a system for acting on it wastes the data a team already has.
Your team generates thousands of data points each month, but only a handful of sales metrics actually predict what happens next. More than 84% of sales reps missed quota last year, according to Vena Solutions' sales statistics report, and enterprise deals now routinely take one to two quarters to close. Tracking the right sales performance metrics stopped being optional a while ago.
The challenge was never gathering data. It's knowing which metrics predict outcomes and which ones just create another dashboard to check. For RevOps and sales managers building next quarter's reporting, this guide covers the sales metrics and sales revenue metrics that actually matter.
That spans pipeline health indicators that forecast deal risk to revenue-specific numbers like ARR and net revenue retention that show whether the business is growing.
Sales metrics are quantifiable data points sales teams use to measure performance across the sales process, from individual rep activity to overall revenue growth. Revenue teams use them to improve their progress and performance, and without the right ones in place, sales teams waste time, resources, and revenue on processes that don't contribute to their success.
Metrics are key indicators of a sales team's health and overall effectiveness, so using them properly can boost rep productivity, efficiency, and execution. They can highlight parts of your sales process that should be adjusted, eliminated, or repeated, helping you maintain a competitive edge.
Sales metrics are only truly valuable if your team is consistently collecting high-quality data. That's challenging, if not impossible, when a team still relies on outdated, manual methods, like spreadsheets or disparate tools.
To get the most from your data, you need intelligent sales analytics software that turns your metrics into actionable insights. Sales engagement platforms, for example, can equip a team with real-time metrics and intuitive dashboards that increase visibility across the entire sales process.
The terms "sales metrics" and "sales key performance indicators (KPIs)" are sometimes used interchangeably. There are real distinctions between the two, though, and the difference determines how a manager should actually use each one.
The sales metrics that provide the most value to your organization will vary depending on factors such as your sales team's objectives, use case, and team structure. Once you've settled those details, choose the metrics that help illustrate the story you're looking to tell or investigate.
Below is a thorough list of the most important metrics for modern sales teams, categorized into five buckets. Here's everything at a glance before the deeper breakdown.
Below, we go deeper into each category so you know what to track, when to track it, and how to use it to drive better outcomes.
The metrics above only drive results when they're organized into a strategic framework. Get the checklist of basic and advanced KPIs that best-in-class sales organizations use to diagnose pipeline issues and anchor revenue decisions.
Sales activity metrics reflect your team's behavioral progress. They're usually the first place to look when a metric further down the funnel starts to slip. They surface whether the problem is a lack of effort or something further along in the process.
This counts new leads generated in a given period, and it's a leading indicator for everything downstream. If pipeline coverage or win rate starts falling while this number holds steady, the problem sits further down the funnel, not at the top.
Raw email volume says little on its own, since a rep can send 200 emails and generate nothing. Track it alongside reply rate, not in isolation. High volume paired with a flat reply rate usually points to a targeting or messaging problem, not an activity problem.
Call volume should generally correlate with meetings booked. When it doesn't, the issue is more often dial quality or targeting than a rep simply not dialing enough, which is worth ruling out before pushing for more raw activity.
Most deals need several touches before a prospect responds. Tracking follow-up count by rep surfaces who's giving up after one or two attempts, which is usually a coachable habit rather than a territory problem.
This is the clearest leading indicator for pipeline a quarter out, since a meeting booked today could become a deal within weeks. A team watching this number weekly has real warning time before a coverage gap becomes a missed target.
Keeping your pipeline as healthy as possible requires a deep understanding of how deals are progressing and what might be holding things up.
Filling your sales pipeline with underqualified leads won't do your team much good. In fact, it'll muddy the waters and negatively impact reps' close rates. Tracking the number of qualified leads (based on your team's specific criteria) in your pipeline over a given period of time can help you better optimize your prospecting process.
Deal win rate is calculated by dividing the number of closed, won deals in a particular time period by the number of opportunities created during that same period. A win rate that's been sliding for a few quarters usually traces back to one of three causes.
Messaging isn't landing, competitive pressure is rising, or underqualified deals are entering the pipeline. Which one it actually is decides whether the fix belongs to enablement, product marketing, or the qualification process itself. A related but distinct question is win rate versus close rate, since teams often conflate the two and end up diagnosing the wrong stage of the funnel.
Typically, smaller deals take less time to close than larger, enterprise-level deals, which generally require more decision-makers. Average deal size helps your team fine-tune its sales strategy, target accounts likely to close within a desired timeframe, and increase sales velocity. Calculate average deal size by adding the value of all closed deals, then dividing it by the total number of deals.
Customer acquisition cost (CAC) is the amount it costs your sales and marketing teams to land a new client. If CAC is high, your team can re-evaluate spend efficiency, identify unnecessary costs and more accurately assess growth potential. Calculate CAC by dividing the sum of marketing and sales costs by the number of closed deals during a particular period.
The length of your sales cycle, or the time it takes for an initial lead to become a paying customer, helps teams evaluate the efficiency and effectiveness of their strategy. A cycle that keeps stretching quarter over quarter usually means one of two things. Either the buying committee is growing, or discovery isn't surfacing the real decision-maker and approval process early enough. Both are fixable, but only once you know which one is actually happening.
Sales pipeline coverage refers to the ratio between the dollar value of your sales funnel and your revenue targets. If, for instance, your pipeline coverage ratio is five, your total pipeline is five times your quota, meaning you need to close 20% of the pipeline's value to meet your sales goal.
If a deal doesn't close within the intended or committed timeline, it's considered slippage. Calculate deal slippage rate by taking the number of deals that failed to close within their committed time period and dividing it by the total number of committed deals for that same period. A slippage rate above 20% usually signals deals are forecast too optimistically, not that the market has suddenly gotten harder. Diagnose deal risk and check forecast discipline before anything else.
Lead generation metrics help improve sales and marketing alignment, ensuring both teams work toward the same goals.
Cost per lead is the average amount your team spends to acquire a new lead. Calculate this metric by dividing the amount spent by the total number of new leads acquired. A rising cost per lead alongside a flat conversion rate points to a channel or targeting problem rather than a budget problem, and spending more rarely fixes it.
Your MQL-to-SQL rate is how quickly marketing qualified leads convert into sales qualified leads. Calculate it by dividing the total number of SQLs generated by the total number of MQLs generated over a given time period, then multiplying by 100. A persistently low rate is more often a sign that marketing and sales don't actually agree on what "qualified" means than a sign the leads themselves are weak.
Your team's conversion rate is the number of qualified leads that result in closed-won deals. Consistently tracking this metric over time shows how efficiently your team turns new leads into paying customers. Calculate conversion rate by dividing the number of leads converted into sales by the total number of qualified leads over a specific time period.
Average lead response time measures the amount of time between new lead creation and when your team sends an initial response. Response inside the first few minutes tends to convert meaningfully better than even a same-day response. That's why this metric usually rewards process fixes, like automated routing and alerts, more than pressuring individual reps to work faster.
To calculate lead response time, take the total time between lead creation and initial response for each lead assigned to a specific rep. Divide that by the number of leads responded to.
Tracking and improving your reps' efficiency and productivity is crucial. Sales productivity metrics help you understand where reps are spending most of their time, so you can reduce any superfluous, time-intensive activities that hinder their success.
Most reps spend only a third of their time actually selling. Measuring the average time each rep, and the team as a whole, spends on selling activities helps identify where the process is hindering productivity, so you can better maximize that time. AI agents that handle account research, meeting preparation, and post-call follow-up can reclaim a meaningful share of the time lost here.
Manual data entry is a productivity-killing task for most sales teams. If your team still relies on manual data collection, you'll likely be surprised at how many hours reps spend entering, transferring, and syncing information throughout the week. Weak CRM adoption is often the root cause, not a lack of rep discipline, so use this metric to determine whether automation can add more value to your team's days.
If reps need to toggle between apps and platforms throughout the day to complete their sales tasks, they're likely wasting precious time. Take stock of the technologies your team relies on and decide whether software consolidation would help reps focus on what they do best: selling.
Sales revenue metrics measure whether the business itself is actually growing, beyond whether individual reps are hitting their numbers. These are the metrics a CRO or CFO reaches for first when the conversation shifts from activity to business health.
Annual recurring revenue refers to your organization's overall predictable revenue across the entire year. Calculate ARR by adding up the monthly revenue your team brings in from each customer and multiplying that total by 12. The number matters less on its own than its trend. Flat ARR alongside strong new bookings usually means churn is quietly canceling out the growth everyone thinks is happening.
Monthly recurring revenue tracks the total predictable revenue your company expects to generate each month from subscriptions. Calculate MRR by multiplying average revenue per account by the total number of accounts that month. New MRR is revenue from new customers, expansion MRR is revenue from upsells and cross-sells, and churn MRR is revenue lost from cancellations. Tracking these three separately shows whether growth comes from new logos or the existing base.
Average revenue per user is the mean revenue from each individual account or customer, typically calculated per month or year depending on your sales or business model. Calculate ARPU by dividing total revenue over a particular time period by the total number of users. A rising ARPU alongside a shrinking customer count can look identical to a rising ARPU from successful upsells, so check both numbers together before assuming the trend is good news.
Net revenue retention measures the percentage of recurring revenue retained from existing customers, including expansions, upsells, downgrades, and churn. Calculate NRR by taking starting MRR, adding expansion MRR, subtracting churned MRR and downgrade MRR, then dividing by starting MRR and multiplying by 100. NRR above 100% means you're growing revenue from existing customers faster than you're losing it.
Customer lifetime value measures the total revenue you expect to generate from a customer over the entire relationship. Calculate LTV by multiplying average revenue per account by gross margin percentage and average customer lifespan. A healthy LTV-to-CAC ratio is roughly 3 to 1. If it costs $1,000 to acquire a customer, that customer should generate around $3,000 over their lifetime.
Churn rate is the percentage of customers who cancel a recurring subscription or don't renew. A 5% increase in retention can increase profits by 25% to 95%, according to Bain & Company's research, so understanding and improving churn is central to a company's growth. Calculate churn rate by dividing the number of customers lost over a specific time period by the total number of customers at the start of that period.
Annual contract value is the average yearly value of a single customer contract, calculated by dividing total contract value by the contract length in years. ACV is especially useful for teams selling multi-year deals, since it normalizes a five-year, $500,000 contract and a one-year, $100,000 contract to the same comparable number.
Most teams don't fail because they lack data. They fail from what they do, or don't do, with the data they already have.
A dashboard with 40 metrics on it gets checked once and then ignored, because nobody can hold 40 numbers in their head well enough to act on any of them. Pick the handful that map directly to a decision someone on the team will actually make this week.
A 25% win rate means something different depending on whether it was 20% last quarter or 35% last quarter. A single snapshot rarely tells you what a metric moving over time can, which is why trend lines matter more than any one data point.
Revenue closed this month is a lagging indicator. It tells you what already happened, and by the time it moves, the deals behind it were decided weeks or months earlier. Pair every lagging indicator with a leading one that gives the team time to actually change the outcome, rather than just report on it after the fact.
Leading indicators help predict your team's performance results. They offer insight into where the team is headed while there's still time to course-correct, and might include the number of new opportunities created, new quotes sent, or average opportunity size.
Lagging indicators, on the other hand, are unchangeable and reflect results already achieved. This can include revenue generated, the number of closed-won opportunities, or quota attainment over a given time period. Sales teams use lagging indicators to adjust their sales plans for better outcomes.
Tracking, measuring, and analyzing all of your team’s most essential metrics and KPIs can seem like an enormous, time-consuming undertaking — especially if you don’t have the proper tools for support.
With tons of metrics to track across activity, pipeline, productivity, and KPIs, the question isn't what to measure; it's how to make sense of it all. Sales dashboards consolidate these metrics into visual formats that reveal patterns, surface risks, and guide decision-making.
Luckily, premade KPI templates and dashboards take a lot of the legwork out of the equation. Platforms like Outreach offer easy-to-use, intuitive AI-powered dashboards that pull all the activity metrics from your CRM, plus additional customer engagement metrics. This gives your team the most comprehensive view of your deals' health, enabling them to intervene before it’s too late. The result is a more effective, efficient team backed by real-time data to improve business outcomes.
Your sales dashboards will vary depending on the tools you use, your specific objectives, and how up-to-date your data is.
Here are some examples of KPI dashboards that sales leaders commonly use on the Outreach platform:
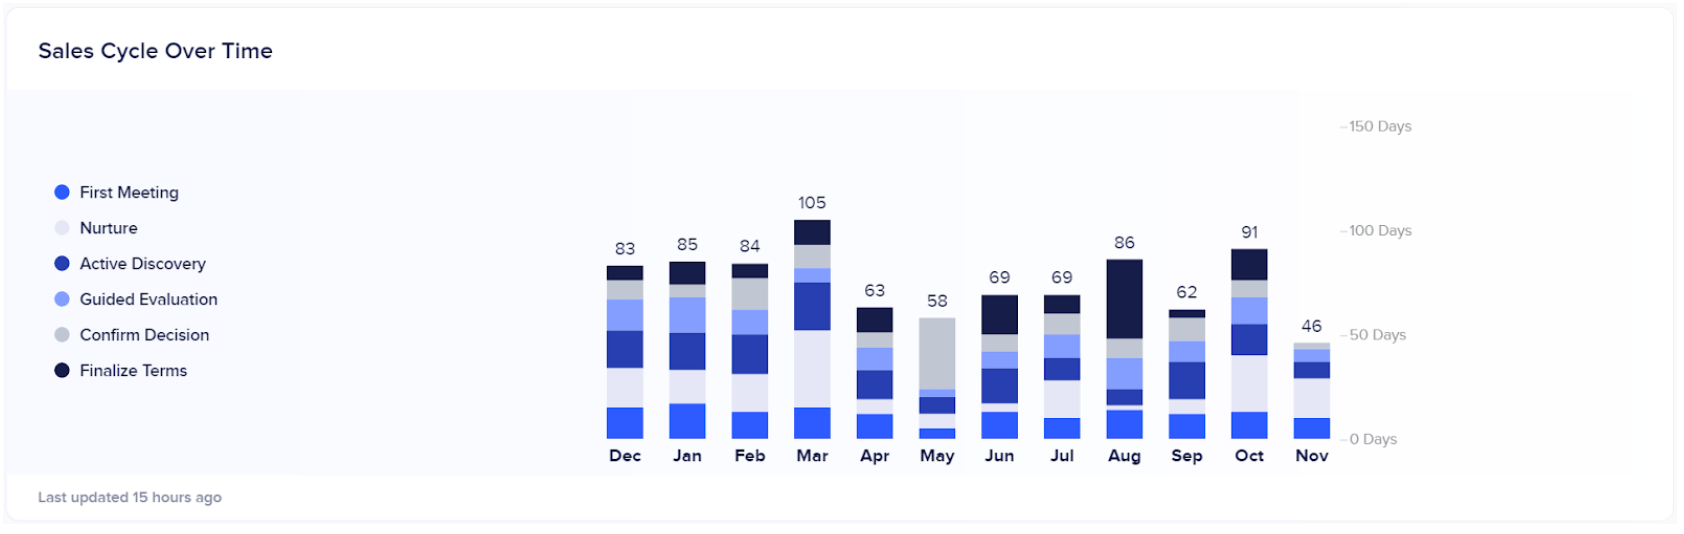
With the sales cycle over time metric, leaders can see how their cycle evolves on a month-to-month basis. The dashboard illustrates each sales stage in a different color in the chart. For each month, the chart shows deals that were closed and won within that given month, regardless of when they were created. The stacked bar representing that month shows the average days they spent in each stage.
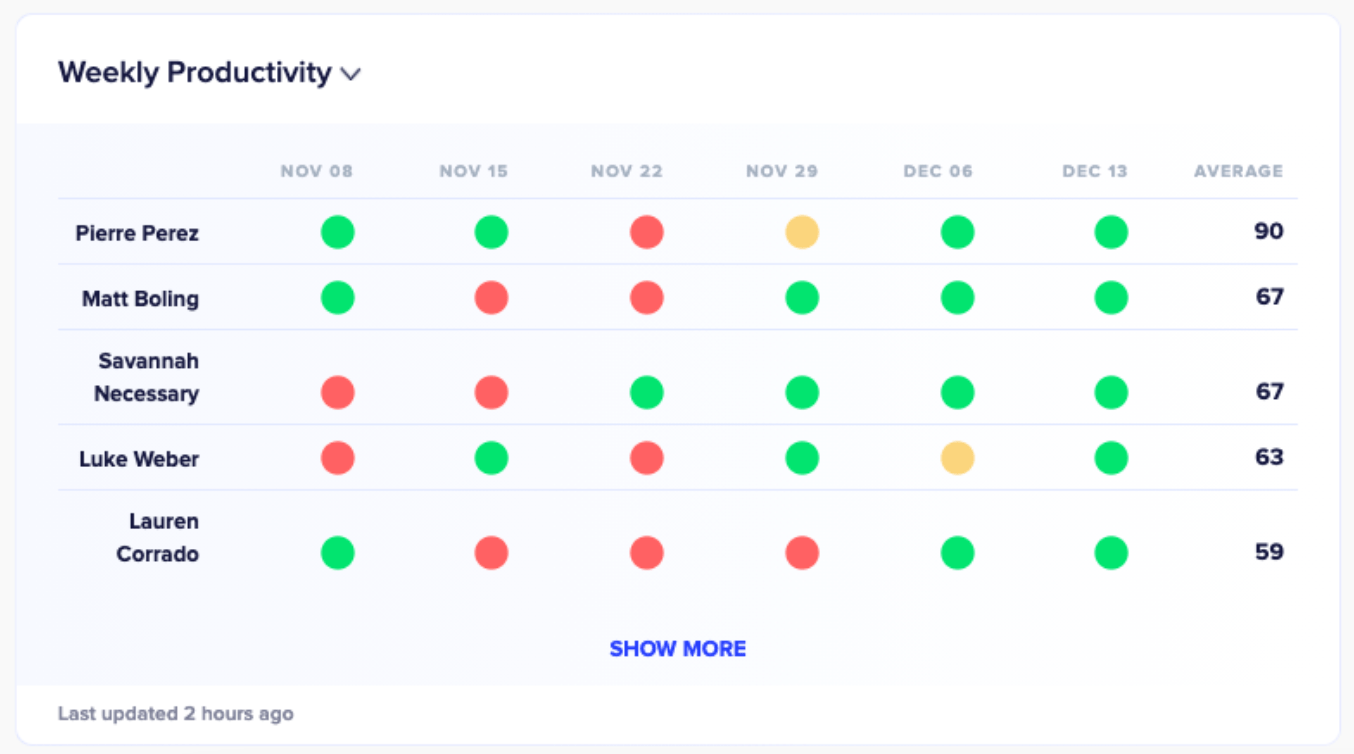
Using scorecards, managers can more accurately analyze their reps’ productivity by combining and tracking any number of variables from week to week. They can set multiple goals across those different variables and assign a weight to each goal. Once the weight has been set, the platform automatically generates a productivity score, represented here by the red, yellow, and green stoplight scorecard.
With this metric, sales teams can break down the various lost reasons within their CRM and easily analyze where things are going wrong and what the average value of those deals is. Each closed loss reason is displayed in the table on the right side, keyed by color. For each average, the platform looks at all of your team's closed loss deals within the last 12 months.
With metrics to track across activity, pipeline, productivity, and revenue, the question isn't what to measure. It's how to make sense of it all without the right tools. Sales dashboards consolidate these metrics into visual formats that reveal patterns, surface risks, and guide decision-making.
Here are a few examples of dashboards sales leaders commonly build to track this data:
This dashboard shows how the sales cycle evolves month to month, with each sales stage in a different color. For each month, it shows deals closed and won within that month, regardless of when they were created, with a stacked bar showing the average days spent in each stage.
Using scorecards, managers can analyze rep productivity by combining and tracking several variables week to week, setting goals across each variable and assigning a weight to each one. The platform then generates a productivity score, often represented as a red, yellow, and green stoplight scorecard.
This view breaks down the reasons deals are lost, keyed by color, along with the average value of those deals for each reason. It's typically looked at across the last 12 months of closed-loss deals.

Building the dashboards above by hand, in a spreadsheet, is exactly the kind of manual work that keeps a team from acting on its own data in time. Outreach, the only agentic AI platform for revenue teams, centralizes activity, pipeline, and revenue metrics in one place. Every AI agent operates on a human-in-the-loop design, surfacing recommendations for a rep or manager to act on, rather than acting on its own.
Instead of building a new report every time a metric needs slicing a different way, a RevOps lead or sales manager can ask Omni Agent, Outreach's conversational AI interface, directly. For example, which reps' pipeline coverage has dropped below target this month.
Deal Agent keeps CRM records accurate by detecting signals from live conversations and automatically recommending field updates. That matters because every metric in this guide is only as trustworthy as the pipeline data feeding it.
AI Topics Explorer surfaces which talk tracks and call topics correlate with metrics like win rate and deal slippage. A manager can see specifically what top performers are doing differently, beyond simply knowing they're doing better.
AI Scored Coach Cards connect an individual rep's coaching plan to the specific metric they're behind on, rather than a generic coaching session disconnected from what the dashboard shows.
A team that tracks 40 metrics and acts on none of them is no better off than a team tracking nothing at all. What matters is whether the numbers on the dashboard change what a rep or a manager does next.
Pick the metrics tied to a decision your team will actually make this quarter, revenue metrics included, and check them against a trend rather than a single snapshot. Outreach, the only agentic AI platform for revenue teams, gives RevOps and sales managers one place to track that data and act on it before the quarter closes, not after.
Book a personalized walkthrough of Outreach's dashboards and revenue metrics tracking, and see how RevOps and sales managers turn activity, pipeline, and revenue data into decisions instead of just reports.
The right metrics depend on your goals and team structure. Most teams need at least one from each category, though: an activity metric, a pipeline metric like win rate, a productivity metric, and a revenue metric like net revenue retention. Tracking one category alone often misses half the picture.
Sales revenue is typically measured through annual recurring revenue (ARR) and monthly recurring revenue (MRR) for subscription businesses, or total closed-won deal value for others. Net revenue retention adds context by showing how much of that revenue came from existing customers versus new ones.
A sales metric measures a specific part of your process, such as the number of calls made. A KPI ties that same kind of data to a specific target, timeline, and business outcome, such as a 40% win rate against a named competitor by the end of the quarter.
Leading indicators, like new opportunities created or average lead response time, are worth checking weekly, since they still leave time to act. Lagging indicators, like closed revenue or quota attainment, are typically reviewed monthly or quarterly, since they reflect results that already happened.